SaaS Metrics Every Early-Stage SaaS Startup Should Track in 2024
When SaaS (software-as-a-service) companies talk about key performance indicators (KPIs), they think of revenue. While estimating income is non-negotiable, it does not paint you the complete picture of your SaaS partner program’s health.
Marketing through channel partners is not as precise as organizing an internal sales team. You will not necessarily retain a transparent picture of your partner’s pipeline. So it would help if you depended upon alternate metrics like contract registration to predict earnings accurately.
Table of contents
What is a SaaS Partner Program?
SaaS companies supply users with the software with monthly or annual subscriptions. Subscriptions free customers from the hassle of managing hardware or installation. SaaS brands have already established user confidence and have developed rapidly in recent years.
Most such SaaS companies provide an opportunity to join their partner programs, creating a win-win situation for both parties. For companies, it’s an easy way to maximize sales efforts; for prospect partners – it is an excellent opportunity to grow their income, just referring qualified leads or sales quickly.
Here are just a few profitable SaaS metrics to observe to maximize the benefits in a SaaS partner program:
- ARR represents the Recurring Revenue a subscriber has had with you for over 12 months.
- MRR measures your predictable revenue stream to deliver performance reporting across several subscription terms and types accurately.
- LTV:CAC ratio measures the amount of money a customer brings in over the entire time they do business with a company.
- Churn Rates
- MRR growth rate implies how much your revenue era is improving over a period
- GRR is a higher-level glimpse at how a company is doing at retaining your customer base by eliminating elements like up-selling, price increases, organic customer development, and more.
Why is ARR an Essential Metric to Monitor?
ARR represents the Recurring Revenue subscribers have had with you for over 12 months (Annual Recurring Revenue). Explicitly utilized by SaaS and subscription businesses with a specified contract length, it is helpful to indicate when term agreements have a minimum of 12 months. Simplified math allows calculations to occur in many various methods across separate contracts.
Those are two specific calculations, but they cover what essential ARR is. Notably, the critical categories of your ARR should include New, Lost, Expansion, Contraction, and the trends and velocities in those numbers. Including these elements is a good measure of the fitness of your company because it emphasizes what you can anticipate repeating and necessary improvements.
How MRR is an Essential Metric to Monitor?
Monthly recurring revenue, or MRR, is the measurement of your predictable revenue stream and is designed to provide performance reporting across various subscription terms and types accurately.
For example, your company may have many customers depending on term length, promotional rates, upgrades, renewals, etc. The varying contracts make measuring your actual growth or even your ARR difficult. MRR allows you to arrive at a pace to easily and quickly diagnose the success of your efforts.
Management software is often recommended because different terms and contracts in a SaaS model are often complicated to manage manually.
Your prospective investors will be inquisitive about your business's MRR for two primary reasons. Firstly, it allows for accurate financial forecasts and constructs planning your business easier. Secondly, it also measures your SaaS business's growth and momentum.
What is a Healthy LTV:CAC Ratio?
Why is ARR an Essential Metric to Monitor?
ARR represents the Recurring Revenue subscribers have had with you for over 12 months (Annual Recurring Revenue). Explicitly utilized by SaaS and subscription businesses with a specified contract length, it is helpful to indicate when term agreements have a minimum of 12 months. Simplified math allows calculations to occur in many various methods across separate contracts.
Those are two specific calculations, but they cover what essential ARR is. Notably, the critical categories of your ARR should include New, Lost, Expansion, Contraction, and the trends and velocities in those numbers. Including these elements is a good measure of the fitness of your company because it emphasizes what you can anticipate repeating and necessary improvements.
How MRR is an Essential Metric to Monitor?
Monthly recurring revenue, or MRR, is the measurement of your predictable revenue stream and is designed to provide performance reporting across various subscription terms and types accurately.
For example, your company may have many customers depending on term length, promotional rates, upgrades, renewals, etc. The varying contracts make measuring your actual growth or even your ARR difficult. MRR allows you to arrive at a pace to easily and quickly diagnose the success of your efforts.
Management software is often recommended because different terms and contracts in a SaaS model are often complicated to manage manually.
Your prospective investors will be inquisitive about your business’s MRR for two primary reasons. Firstly, it allows for accurate financial forecasts and constructs planning your business easier. Secondly, it also measures your SaaS business’s growth and momentum.
What is a Healthy LTV:CAC Ratio?
So how do you know if you are disbursing the proper amount of capital? You require some numbers. First, you must understand how long the average consumer stays with you before withdrawing from your service. Because, of course, the longer a customer lasts with your business, the more beneficial they are for your continued success.
Begin by observing your churn rate – the number of people who cancel their subscription in any given month. If you have 1,000 customers and 20 of them cancel every month, that works out to two percent monthly churn.
By merely inverting this value ( 1 / Monthly Churn ), you can compute how many months your consumers will stick around on average. At a 2% monthly churn, that works out to 50 months.
It is also required for you to compute your Gross Margin % (the percentage of earnings that stays after you have disbursed your expenses for the product or service) and how much capital the average consumer brings in every month.
Customer Lifetime Value = Gross Margin % X ( 1 / Monthly Churn ) X Avg. Monthly Subscription Revenue per Customer
So, for example, if your gross margin was 75% and your monthly consumer churn was 2%, and each consumer paid an average of $40 with you every month, the computation would appear as 75% X ( 1 / 2% ) X $40 = $1,500 LTV.
Now your lifetime value as a customer has been calculated. You can now turn your attention to figuring out how much you spend cultivating a customer.
Usually, the sales and marketing budgets are added together to find this answer. Although to be more accurate, the cost of acquiring a customer is the whole sales and marketing budget divided by the number of new customers obtained in a provided time. The calculation works best if your sales cycle is short. Having your sales and marketing costs tied to new customers in the same period will be helpful. If your sales cycles are longer, you may want to stagger your expenses and recent customer acquisition cost to get a more precise illustration.
Cost to Obtain a Customer = Sales and Marketing Costs / New Customers Won
If you kept full monthly sales and marketing costs of $500K and cultivated 500 unique clients in a provided month, the computation would be $500,000 / 500 = $1,000 CAC.
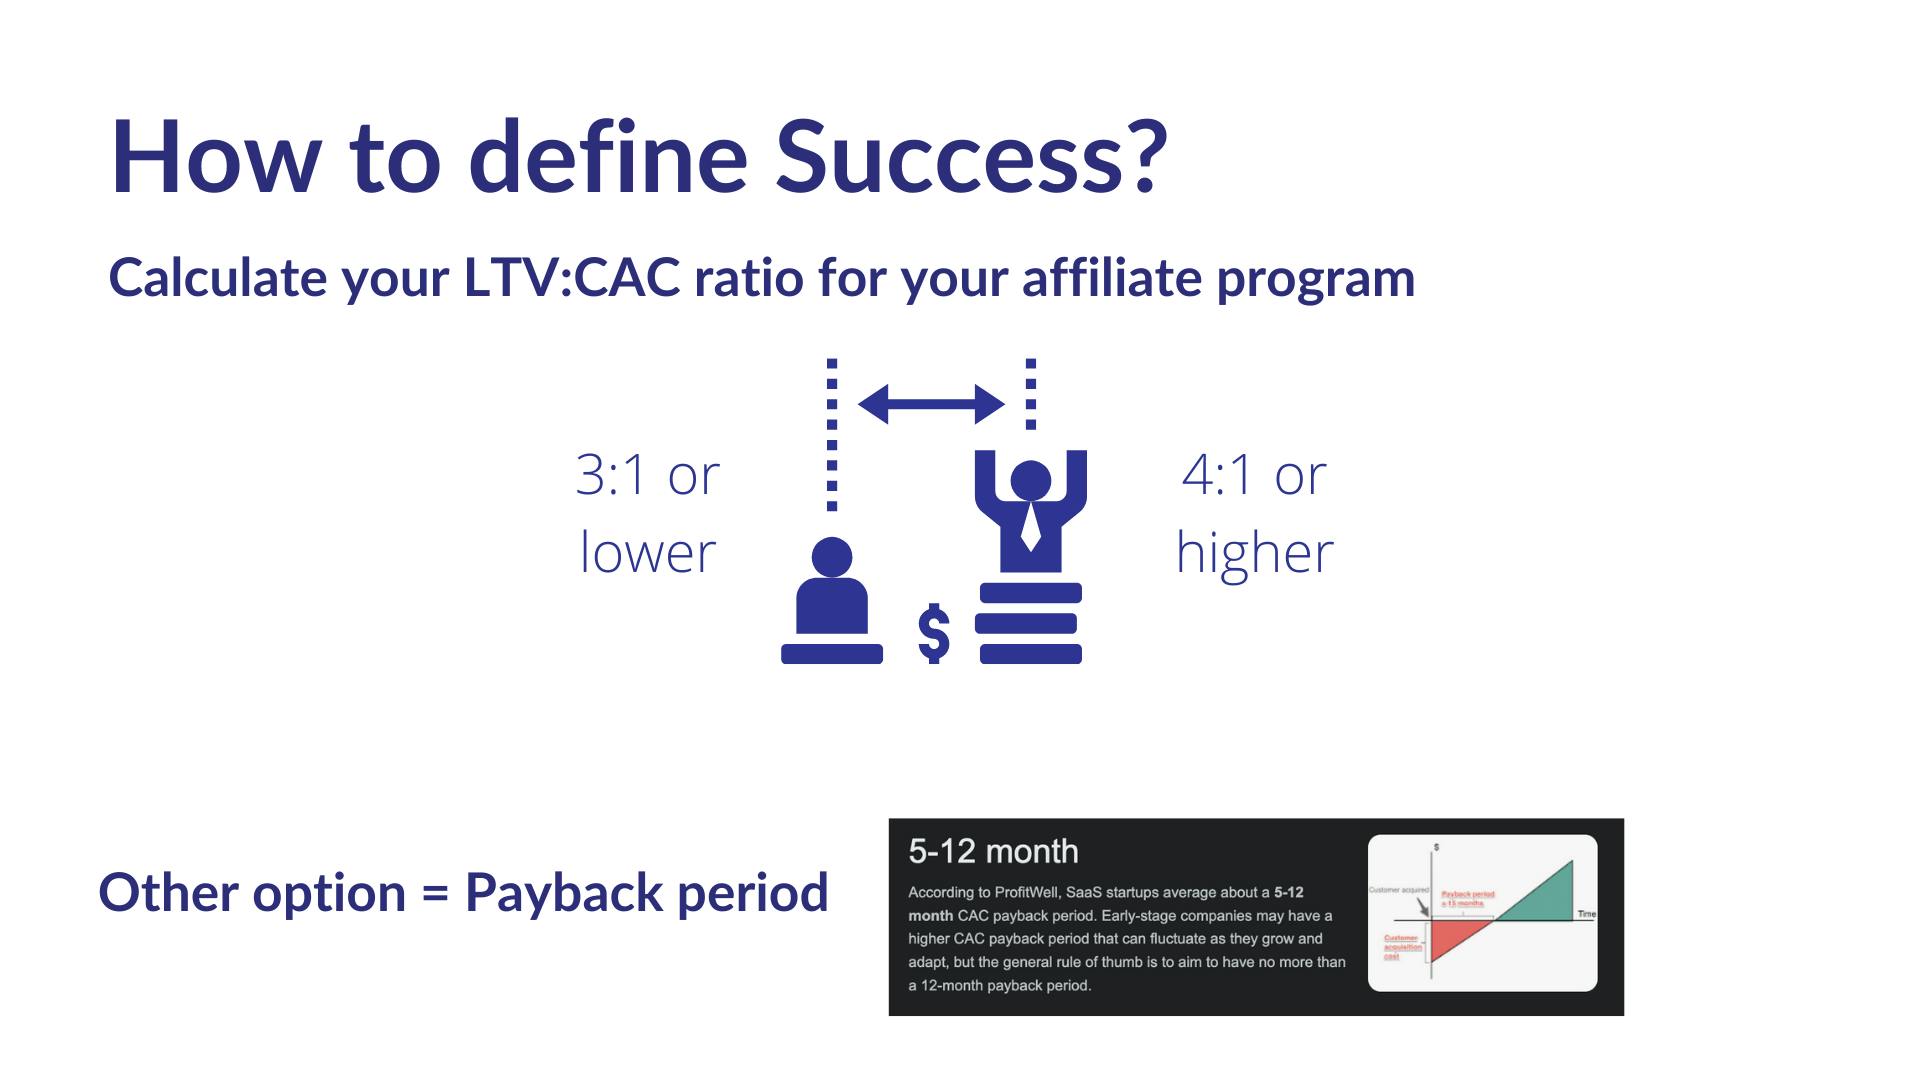
Ideally, you desire to regain the expense of obtaining a consumer within the first 12 months. In different terms, if the average consumer fetches you $1,500 over 50 months, you should be disbursing about $360 to obtain consumers.
An excellent LTV:CAC ratio should exist at 3:1.The significance of a consumer should be three times more than the expense of attaining them. If the proportion is close, i.e.1:1, you are disbursing too much money. If it’s 5:1, your budget money is not enough. Thus you could be missing out on business opportunities.
It rings clear, and it is. But the point remains, you must understand these numbers. Because the more you know what pushes your company, the more levers you can pull to expand your company.
A great way to keep your LTV:CAC ratio low is to start an affiliate program, as you don’t have costs until you receive paid clients.
Why are churn rates an Essential Metric to Monitor?
When discussing churn, we discuss many factors that their attribution or loss can measure. For instance, you can calculate the loss in customers, contracts, contract value, booking, MRR, and GAAP revenue. The loss is commonly represented as a ratio or rate but can also be described as a whole number.
Across the industry, this is one of the most prevalent metric controversies for SaaS companies, and it’s highly comparable. No matter what you’re measuring, churn is defined by your unique company goals and whatever is acceptable to your stakeholders. However, that doesn’t mean that there aren’t a few standard churn metrics to note.
The three most common churn metrics you should observe are:
- Customer Churn: Plain and simple, this is the loss of customers. Many know it by other names: customer attrition, customer turnover, or customer defection, and it’s one of the most critical “fitness” measures for your business.
If there is a uniform drop-off moment in your resolution, you understand there is something that requires awareness in your procedure or service. Typically, companies with SaaS business model register anywhere from 5-7% consumer churn rates, so you will learn when you must re-evaluate.
- Revenue Churn: Revenue churn looks at the missing revenue rate over a while. It is also calculated similarly to consumer churn rates. You begin by selecting a time frame and taking out all of the new average revenue you earned.
For example, You made $100,000 in earnings last quarter and made $90,000 in profits this quarter. Here is the simple math:
(100000-90000)/100000 = 10% Revenue Churn
For your business: If you deliver additional products and services, you must track churn for each of these different offerings to obtain more helpful discernment into the success of your offerings.
- Recurring Revenue (ARR/MRR) Churn: Recurring Revenue Churn brings a glance at the monthly recurring revenue (MRR) and estimates how much MRR loss (from both canceled consumers and downgraded consumers) was in the period. Here is an example:
% MRR churn rate = Churned MRR/Previous Month
So, if your business had 100 clients in January at $200 and 90 clients in February at $200, this is the revenue churn:
January: 100 x $200 = $20,000 MRR
February: 90 x $200 = $18,000 MRR
Revenue churn = (20,000-18,000)/10,000 = 2,000/20,000 = 10%
How MRR Growth rate is an Essential Metric to Monitor?
The MRR growth rate suggests how your revenue generation enhances over a specific period. It is a critical metric to measure as you compute how much swiftness and market traction your business is encountering. When your MRR growth rate continues to rise steadily, it’s one of the best indicators to expand your business.
Here’s the calculation:
For example, if your net MRR for this month is $790,000 and last month’s net MRR was $660,000, your company is expanding at 16.45%.
While there are no accurate benchmarks for SaaS growth rates, if you’re a post-Seed or Series A start-up, you’ve hit traction with your market if you land with a double-digit percentage. With a 10% MRR growth rate, you’re in a good place, and if you’re at 15%, you’re experiencing robust growth.
Why is GRR an Essential Metric to Monitor?
Gross Revenue Retention (GRR) is a higher-level peek at how your business is accomplishing retaining customers by eradicating factors like organic customer growth, up-selling, price increases, etc. It is always equal to or lower than your NRR and is always between 0% and 100%. Here’s how to calculate it:
GRR: (Current MRR from a customer group – upsells)/ MRR from the same group one year ago
The closer your rate is to 100%, the better equipped your company can sustain healthy development over time.
What is the Customer Acquisition Cost (CAC) Payback Period?
The Customer Acquisition Cost (CAC) Payback Period is a critical SaaS metric that measures the amount of time it takes for a company to earn back its investment in acquiring a new customer. This is typically calculated by dividing the CAC by the monthly recurring revenue per customer, further divided by the gross margin.
This metric is crucial because it provides insights into your cash flow, efficiency, and overall business sustainability. A shorter payback period indicates a healthier, more efficient SaaS business model, as it shows that the company can quickly recover its initial investment. On the other hand, a longer payback period signifies that the company is taking a longer time to recoup its investment, potentially indicating issues with customer retention or the company's pricing model.
How to Use NPS in predicting business growth and customer satisfaction?
Net Promoter Score (NPS) is a powerful tool that measures customer satisfaction and loyalty. It categorizes your customers into three groups: Promoters (score 9-10), Passives (score 7-8), and Detractors (score 0-6). The score is calculated by subtracting the percentage of Detractors from the percentage of Promoters.
NPS can be a useful predictor of business growth and customer satisfaction as it is directly linked to customer loyalty and word-of-mouth referrals. A high NPS indicates a large number of satisfied and loyal customers who are likely to recommend your SaaS product to others, leading to organic business growth. Regularly measuring and tracking your NPS can help you identify areas of improvement, enhance your product or service, and ultimately drive business success.
The role of Revenue Per Customer (RPC) in understanding customer value
Revenue Per Customer (RPC), sometimes known as Average Revenue Per User (ARPU), is a key metric that determines the average revenue generated by each customer. This is calculated by dividing the total revenue in a specific period by the number of customers in that same period.
RPC is essential in understanding the value of each customer to your business. It gives you a clear understanding of how much each customer contributes to your revenue. This insight is crucial in making informed decisions about your pricing strategy, marketing budget, and customer service efforts. By focusing on increasing RPC, you can drive revenue growth without necessarily needing to increase your customer base.
Importance of Time to Value (TTV) in customer satisfaction and advocacy
Time to Value (TTV) is a SaaS metric that measures the period it takes for a customer to realize value from your product or service. This could be the time it takes to successfully onboard a customer, or the period until a customer achieves a key milestone or result from using your product.
TTV plays a vital role in customer satisfaction and advocacy. A shorter TTV can enhance customer satisfaction as customers can quickly see the value of their investment. This positive experience can lead to higher customer retention rates and make your customers more likely to become advocates for your product, driving referrals and organic growth. On the contrary, a long TTV could lead to customer frustration and higher churn rates. Therefore, focusing on strategies to reduce TTV can significantly improve your SaaS business's overall customer experience and success.
Incorporating Predictive Analytics in SaaS Metrics
Predictive analytics is a branch of advanced analytics that uses both new and historical data to forecast activity, behavior, and trends. In the context of SaaS metrics, predictive analytics leverages machine learning and statistical algorithms to foresee future outcomes based on historical data.
Exploring the Role of Predictive Analytics in SaaS Metrics
Predictive analytics has a significant role in SaaS metrics. It helps businesses identify patterns in customer behavior, product usage, and revenue generation, providing crucial insights that can drive business strategy. These insights can help companies preemptively address potential issues, thereby improving customer retention and boosting revenue.
For instance, predictive analytics can help a SaaS company identify which customers are likely to churn based on their engagement level with the software. The company can then implement targeted strategies to increase engagement and reduce churn.
Predicting Future Trends and Customer Behaviors
One of the most powerful uses of predictive analytics in SaaS metrics is the ability to forecast future trends and customer behaviors. By analyzing historical data, predictive models can identify trends and patterns that may indicate future behavior.
For example, a SaaS company might use predictive analytics to identify seasonality trends in their subscription rates, or to predict which users are likely to upgrade to a premium package based on their usage patterns. These insights allow companies to proactively adjust their strategies and make informed decisions to capitalize on these trends.
Influencing Product Development, Marketing Strategy, and Sales Forecasting
The insights gained from predictive analytics can have a profound influence on a company's product development, marketing strategy, and sales forecasting.
In terms of product development, predictive models can reveal features that are driving user engagement and those that are not, helping product teams prioritize their development efforts accordingly.
In marketing, predictive analytics can identify which marketing channels are most effective at acquiring new customers, or what characteristics define a company's most valuable customers, thereby informing the targeting and segmentation strategies.
Finally, in sales forecasting, predictive analytics can provide accurate forecasts of future sales based on historical sales data and other factors such as market trends or promotional activities, allowing sales teams to plan more effectively and meet their targets.
In essence, predictive analytics helps SaaS companies move from a reactive approach to a more proactive and strategic one, driving better business outcomes.
The Bottom Line
Across these most important metrics, it is critical to understand the importance of the accuracy of these calculations. We have noticed that many new and established SaaS companies create the blunder of attempting to address these figures manually, ultimately sacrificing accuracy and consistency. Many companies have also changed how they calculate a metric for one purpose or another without a clear strategy. When they do this, they also lose the ability to compare metrics.
Then, one is left to wonder, “Is this the new CLV or the old CLV?”. Ultimately this is not something you want to get asked.
At Reditus, we are equipped to manage the ins and outs specific to the B2B SaaS industry.

When you are considering B2B SaaS you need to understand what is a B2B model first. Though if you are not aware we will provide you examples of all four different types …
If you want to grow your SaaS you will need to forecast your revenue. Learn everything you need to know about revenue forecasting.