The Beginner’s Guide to Cohort Analysis

Analysis precedes strategy. Cohort analysis is a powerful tool for understanding customer behavior. By tracking groups of users with common characteristics, you can identify patterns and trends that would be otherwise hidden.
Without understanding how customers behave, it’s impossible to make informed decisions about where to allocate your time and resources.
This guide will teach you everything you need about cohort analysis, including how to set up tracking, what metrics to follow, and how to interpret your results.
Table of contents
What Is Cohort Analysis?
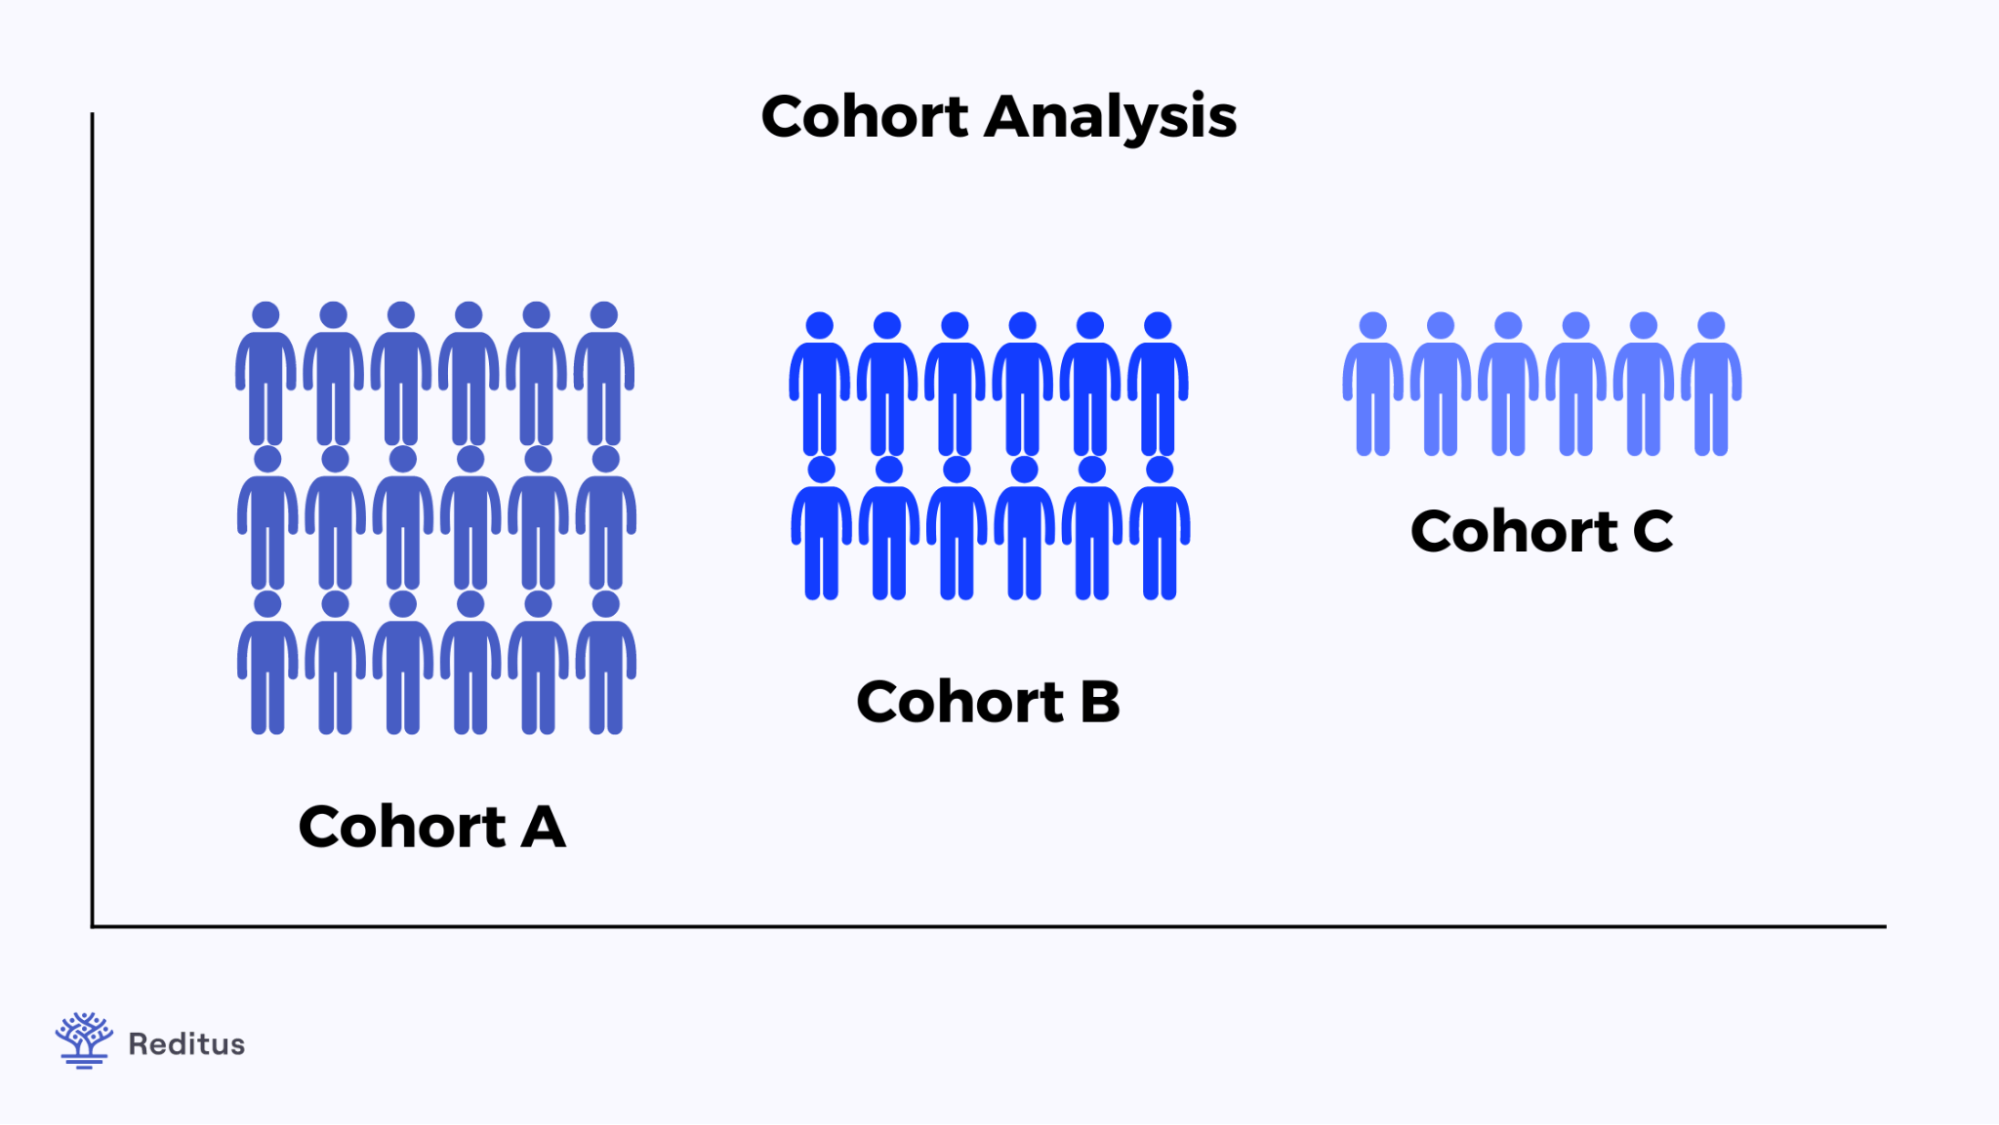
A cohort is a group of users who share common characteristics.
You can define cohorts based on any characteristics that are important to your business, but the most common cohorts are represented by:
- Signup date: All users who sign up for your product on the same day (or within the same week, month, etc.) are grouped in a signup cohort. This is the most common type of cohort, and it’s often used to track retention rates.
- Product usage: All users who reach a certain level of product usage are grouped in a usage cohort. For example, you might track all users who complete your onboarding flow or those who make a purchase.
- Payment plan: All users who subscribe to the same pricing plan are grouped in a payment plan cohort. For example, you might track all users on your free trial or those who pay for your premium features.
Cohort Analysis Examples
Cohort analysis is a tool for understanding how groups of users interact with your product over time, helping you make more informed business decisions.
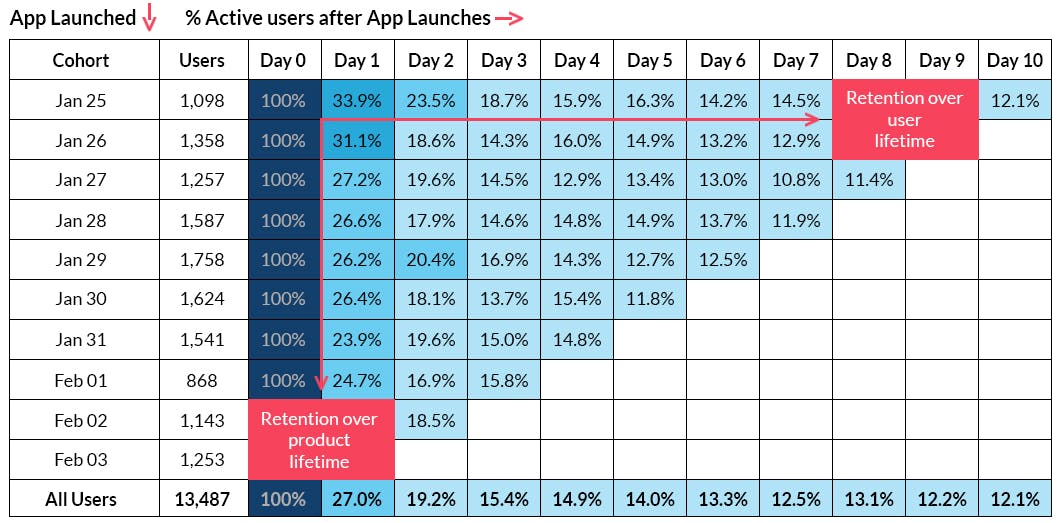
For example, suppose you want to track retention rates for your product. You could track the number of users who sign up for your product daily and then follow how many users are still using your product 30 days later.
This would give you a retention rate of 30%. But this number doesn’t tell you how your product is being used.
To better understand your product, you need to track how users interact with it over time. This is where cohort analysis comes in.
With cohort analysis, you would group users by signup date and then track how many users are still using your product 30 days later. This would give you a retention rate for each signup cohort.
For example, suppose you have a retention rate of 30% for users who sign up on Monday and a retention rate of 40% for users who sign up on Tuesday. This tells you that there’s a difference in how these two groups of users interact with your product.
Ultimately, cohort analysis can help you answer important questions about your business, such as:
- How are different groups of users interacting with my product?
- What features are being used the most?
- How is my product being used over time?
- What is the lifetime value of a customer?
How to Implement Cohort Analysis On Your Business
There are three steps to using cohort analysis:
- Define your cohorts
- Collect data on how these cohorts interact with your product
- Analyze the data to identify trends and make informed decisions
Let’s take a closer look at each of these steps.
1. Define your cohorts
The first step is to define your cohorts. As we mentioned, we can define cohorts based on any characteristics important to your business.
The most common cohorts are signup date, product usage, and payment plan. Still, you can also define cohorts based on geography, device type, or other criteria important to your business.
Once you’ve selected the criteria for your cohorts, you need to decide how to group users into these cohorts.
For example, you could group all users who sign up for your product on the same day into a signup cohort. Or you could group all users who sign up for your product in the same week, month, or year.
How can you decide which signup period is right for your business?
There’s no one-size-fits-all answer to this question. The signup period you choose will depend on your business goals and the nature of your product.
For example, if you have a subscription product, you might want to group users by signup month to track monthly retention rates.
If you have a product with a long sales cycle, on the other hand, you might want to group users by signup year so you can track annual retention rates.
2. Collect data on how these cohorts interact with your product
Once you’ve defined your cohorts, you need to collect data on how these cohorts interact with your product.
There are two types of data you need to collect:
· Engagement data: This data tells how users interact with your product.
· Conversion data: This data tells you what actions users take in your product.
Engagement data can be collected using analytics tools like Google Analytics or Mixpanel. This data can include page views, time spent on site, and the number of sessions.
Conversion data can be collected using your product’s database. This data can include signups, upgrades, and cancellations.
You can also collect data on customer lifetime value (LTV) using your product’s database. LTV is the total revenue a customer generates for your business throughout their relationship with your product.
3. Analyze the data to identify trends and make informed decisions
Once you’ve collected data on how your cohorts interact with your product, you need to analyze this data to identify trends and make informed decisions.
There are a few different ways to analyze cohort data:
- Retention rate: This metric tells you what percentage of users in a cohort are still using your product after a given period.
- Engagement rate: This metric tells you what percentage of users in a cohort are taking a given action in your product.
- Conversion rate: This metric tells you what percentage of users in a cohort are converting from one product state to another.
- LTV: This metric tells you the average amount of revenue a customer in a cohort generates throughout their relationship with your product.
To calculate any of these metrics, you need to have data on how many users are in each cohort and how these users are interacting with your product.
This data can be collected using analytics tools like Google Analytics or Mixpanel, or it can be collected from your product’s database.
Once you have this data, you can use it to identify trends and make informed decisions about growing your SaaS company.
For example, if you see that users in a particular cohort have a high retention rate, you might want to focus on acquiring more users like them.
Or if you see that users in a particular cohort have a low conversion rate, you might want to focus on improving your product’s onboarding process.
Of course, these might be oversimplified examples, but they illustrate how you can use cohort data to inform business decisions.
What Are the Challenges Involved in Cohort Analysis?
Cohort analysis can be a powerful tool for growing your business, but it’s not without its challenges.
Challenge 1: It can be time-consuming to set up and maintain
You need to define your cohorts, collect data on how these cohorts interact with your product, and then analyze this data to identify trends.
This can be a lot of work, especially if you have many cohorts.
When starting, you might want to focus on a few key cohorts and then expand your analysis over time.
For instance, you might want to focus on your most active users and your most valuable customers.
Challenge 2: It can be difficult to collect accurate data
This is especially true if you’re relying on data from multiple sources.
For example, if you’re using data from your product’s database and an analytics tool like Google Analytics, you need to ensure that these data sets are compatible.
Otherwise, you might end up with inaccurate results.
To avoid this problem, it’s best to use data from a single source whenever possible.
Challenge 3: It can be difficult to identify the right cohorts
There are a lot of different factors you can use to define your cohorts, and it can be challenging to know which ones are most important.
To make things easier, start by focusing on your most important metric.
For example, if you’re trying to increase customer lifetime value, you might want to focus on cohorts of customers who have purchased in the past year.
You can experiment with different cohort definitions to see what works best for your business.
Conclusion
Cohort analysis can help you grow your SaaS company by identifying trends and making informed decisions.
However, it can be challenging to set up and maintain. Additionally, it can be difficult to collect accurate data and identify the right cohorts.
Despite these challenges, cohort analysis is a powerful tool that can help you understand your customers and make better decisions that’ll direct your business in the right direction.


Often terms involving computers use acronyms. We may not be familiar with frequently used B2B SaaS terms too. We may know B2B stands for business to business, and SaaS is …
Vital B2B SaaS Knowledge and Frequently used Terms Read More »

When you are considering B2B SaaS you need to understand what is a B2B model first. Though if you are not aware we will provide you examples of all four different types …